News & Research
APTA’s News and Research brings together timely industry updates and trusted analysis to help the public transportation community stay informed and forward-looking. From breaking policy developments to in-depth research and reports, this content supports data-driven decision-making and highlights the trends shaping public transportation across North America.

About the Industry
APTA provides a broad range of resources and information on public transit.

Newsroom
See the latest public transportation news and information from APTA.
Passenger Transport News Center
Passenger Transport: APTA’s News Center provides up-to-date public transportation industry news, APTA updates, analysis, commentary, and features.
Podcasts
The Transit Authority podcast highlights the people, organizations, and ideas that are transforming public transportation.

Policy Research
APTA provides trusted analysis and insight to help inform decision-making across the public transportation industry with research that explores the economic, environmental, workforce, and community impacts of transit.

Public Transit Statistics
APTA statistical products serve as the definitive resource for industry statistics, primarily the annual Fact Book.
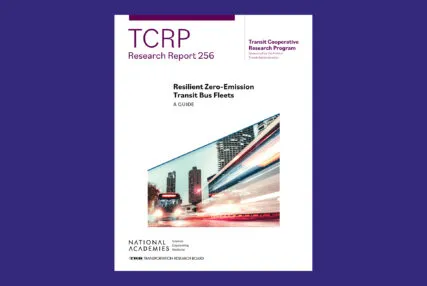
Transit Cooperative Research Program (TCRP)
The Transit Cooperative Research Program (TCRP) develops near-term, practical solutions to problems facing public transportation.
Stay Connected
Stay Connected
Stay Connected
Stay Connected
Stay Connected
Stay Connected
Stay Connected
Stay Connected
Stay Connected
Stay Connected
Subscribe to the Need-to-Know News