Introduction
Chairman Crawford, Ranking Member Norton, Representative Titus, and Members of the Subcommittee on Highways and Transit of the Committee on Transportation and Infrastructure, on behalf of the American Public Transportation Association (APTA) and its more than 1,600 public- and private-sector member organizations, thank you for the opportunity to testify on Revenue, Ridership, and Post-Pandemic Lessons in Public Transit.
My name is M.J. Maynard and I am Vice Chair of APTA, an international association representing the $79 billion public transportation industry that directly employs more than 430,000 people and supports millions of private-sector jobs.1
I also serve as CEO of the Regional Transportation Commission of Southern Nevada (RTC). RTC is the public transit provider, traffic management agency, and Metropolitan Planning Organization (MPO) for Southern Nevada. As the MPO, RTC works with local jurisdictions to plan, program, and fund roadway and other surface transportation projects in the Las Vegas region. RTC’s public transit service is a core component of our mission—it connects our region’s underserved communities, provides access and opportunities for 2.3 million residents to get to work, school, home, healthcare services, and social activities. It is the 14th busiest bus system in the United States, serving an average of 153,000 boardings every weekday. In 2023, RTC provided more than 50 million passenger trips, and 80 percent of our transit riders use the service to get to and from work. RTC operates the most efficient bus-only transit system in the country, with the highest farebox recovery ratio, lowest public subsidy, and third lowest operating costs.
On behalf of APTA, I would like to share with the Subcommittee issues that are critical to our industry, including ridership, revenue, and the need for sustained investment. Investment in public transportation helps communities of all sizes flourish—connecting workers to jobs, students to school, and people to healthcare. Accessible, affordable public transportation helps families, students, and workers save money and grow the economy.
Public Transit Is Essential
Public transit is an essential service—providing mobility options for Americans, supporting economic growth, improving the environment, making our roads safer for drivers and pedestrians, and serving critical roles during natural disasters and other emergencies. When the COVID-19 pandemic disrupted the lives of every American, public transit served as an essential lifeline. Public transportation systems brought healthcare professionals to the frontlines, delivered groceries and medicine to at-risk populations, and connected essential workers to their places of work.
Given official declarations to close businesses and impose stay-at-home orders, as well as other measures such as a dramatic increase in remote work, public transit agencies across the nation faced severe ridership declines and state and local revenue losses. Yet, we continued to serve our communities despite significantly increased operating costs and dramatically reduced sources of funding, including fares and other revenues. In most places, fare collection was suspended for safety reasons.
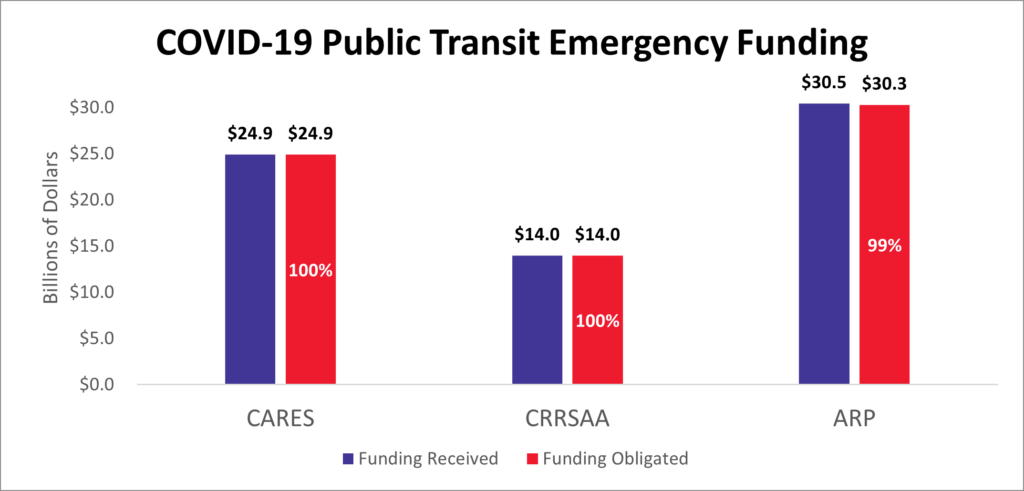
We thank Congress for recognizing public transit’s essential role and passing COVID-19 emergency relief legislation to provide significant support for transit operating costs that was essential to the very survival of public transit agencies. Transit agencies invested these emergency funds in services that are vital to their communities. These funds also allowed agencies to continue investing in their capital programs, such as funding state-of-good-repair projects. Together, these efforts enabled agencies to maintain good-paying jobs and help the U.S. economy recover in the wake of the pandemic.
Today, 99.8 percent of the COVID-19 public transit emergency funds are obligated to specific projects and more than 90 percent of these funds are fully expended.
Ridership Recovery
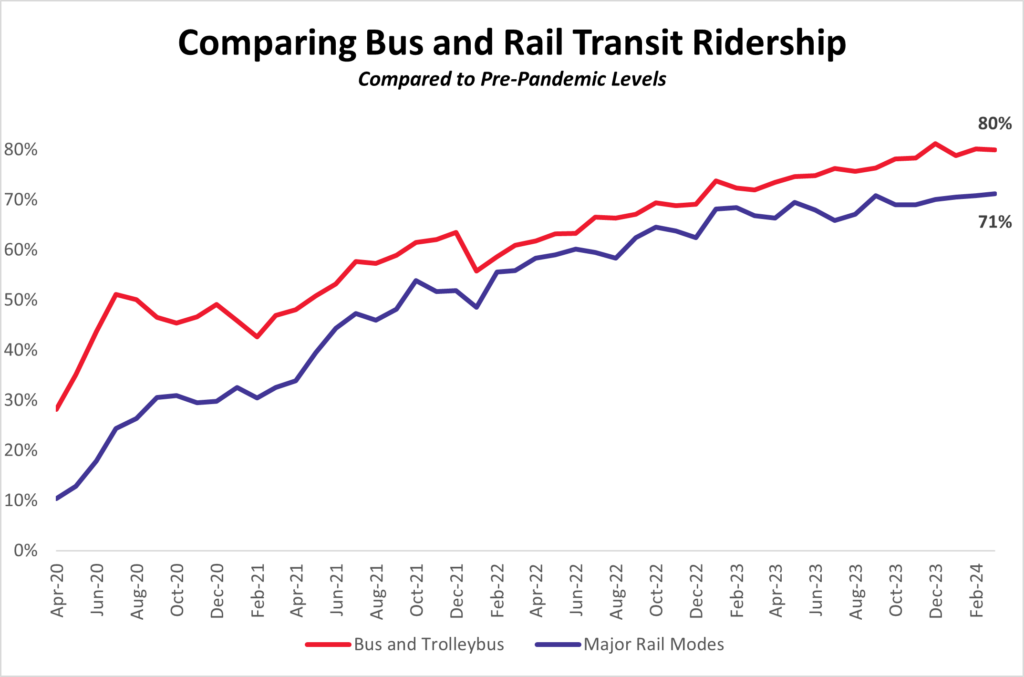
Public transit is a key driver in building a 21st-century transportation system that will support economic recovery, provide opportunities, address climate resilience, and increase our global competitiveness. After falling to 20 percent of pre-pandemic levels in April 2020, public transit ridership has reached 80 percent of pre-pandemic levels. For instance, in 2023, ridership increased by 16 percent, and a growing number of systems have surpassed their pre-pandemic ridership. These facts demonstrate the tremendous resiliency of this industry.
It is important to recognize the enormous scale of our nation’s public transit ridership. Transit riders took 7.1 billion trips in 2023—an average of 24 million trips each day. Success in ridership recovery has been dependent on transit service delivery and reliability and external factors, such as the makeup of local economies.
In Southern Nevada, transit ridership has recovered to the national average of nearly 80 percent of pre-pandemic levels. At RTC, transit riders took more than 50 million trips in 2023. To date, RTC ridership recovery has been driven by its daily riders, rather than tourists on the Las Vegas Strip.2 Thus, we have more room to grow in the coming year.
In 2023, public transit increased 16 percent nationwide,3 even though office occupancy remained stagnant. According to Kastle Systems, throughout all of 2023, office occupancy remained flat at approximately 50 percent.
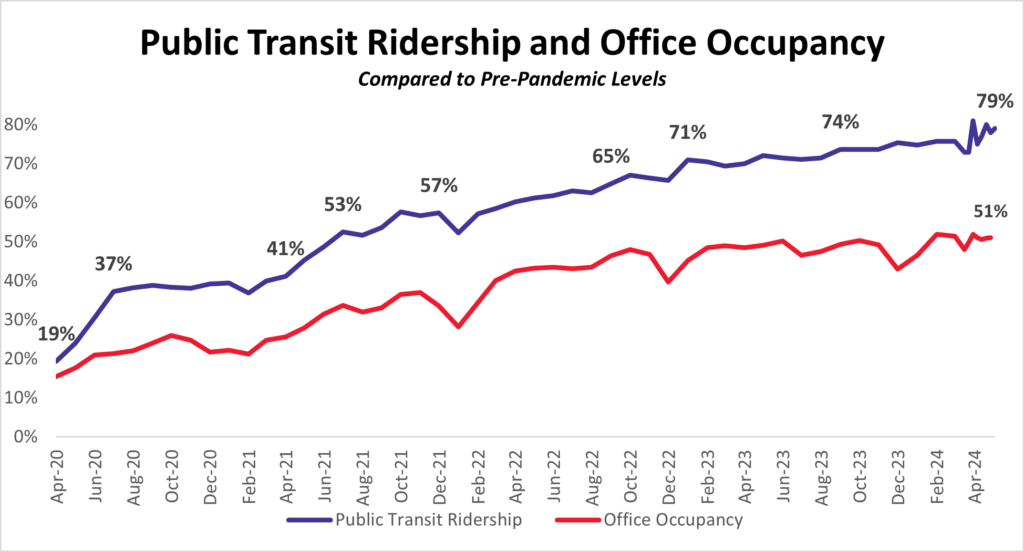
Developing Solution-Oriented Service Models
Public transit agencies have outpaced the return to office by developing new solution-oriented service models to address specific community needs: people living in areas currently underserved by transit, individuals who require wheelchair access, and riders who commute during off-peak, late-night hours. On-demand ride-sharing services, vans and shuttle buses, and other micro-mobility options (e.g., bikes, scooters) provide customers the access and flexibility they need to connect to transit or their final destinations, reduce commute times, and decrease reliance on personal cars.4
In addition, public transit agencies are harnessing new smart technologies to better serve customers and enhance safety. As traffic manager for the Las Vegas region, RTC received a $3.5 million grant to implement a pedestrian detection/collision avoidance system that uses artificial intelligence (AI) to identify potential hazards and alert drivers in real time. The system is comprised of multiple smart cameras equipped with night-vision technology, strategically placed to maximize coverage of vulnerable road users who enter designated danger zones surrounding the bus; interior and exterior speakers that provide audible alerts to warn drivers and vulnerable road users of a potential collision; and driver alert displays within the bus that warn the operator of a potential hazard.
Beyond ridership numbers and percentages, it is critically important to recognize why people take public transit—it creates opportunities. In Southern Nevada, based on a recent survey, approximately 80 percent of customers use RTC to get to and from work or to seek employment. Particularly for lower-income workers, public transit is a lifeline. According to a recent APTA study, people can save more than $13,000 each year by using public transit instead of driving.
State and Local Fiscal Impacts
Public transit agencies navigated the unprecedented decreases in ridership and fare revenue resulting from the pandemic by adapting services to different needs, including aligning service patterns, investing in innovative projects to draw ridership, and improving capital planning. While ridership levels have recovered to 80 percent of pre-pandemic levels nationwide, they vary by mode and agency. The slower recovery of rail ridership has a significant impact on multi-modal transit agency fare revenues because rail systems generally have a much higher fare box recovery ratio compared to bus systems. In addition, there is some evidence that fare evasion has increased in the last three years leading to lost revenue for public transit systems. Transit agencies are making significant efforts to reduce fare evasion.5
The loss of farebox revenue has a much more pronounced impact on public transit agency operating budgets because farebox and other agency revenues (such as advertising) provide on average 35 percent of transit agency operating budgets. Conversely, these revenues provide only 11 percent of capital budgets.6
In addition, operating costs have increased substantially since 2019. Inflation has increased the price of goods and services that transit agencies purchase. The tight labor market has led agencies to increase compensation to attract and retain workers, which has also increased costs.
As a result of these increased costs, together with the fact that fare revenues have not fully recovered, some transit agencies are facing looming operating budget shortfalls, or a “fiscal cliff”. In a 2023 APTA survey, one-half of responding agencies (51 percent) indicated that they will experience a fiscal cliff in the next five fiscal years.7 Many public transit agencies have implemented efficiencies to reduce their costs and worked with their communities to identify state and local funding sources to address operating shortfalls. In 2023 and 2024, many States, including New York, California, Minnesota, New Jersey, Maryland, Virginia, and the District of Columbia, have reached State and local budget agreements that provide tens of billions of dollars of new State and local funding for public transit through a combination of revenue, funding, cost reduction measures, and fare increases. These agreements include everything from sales taxes and casino licensing fees to streamlining operations and fare increases.
Building for the Future
APTA is sincerely thankful for the historic investments in public transportation in the Infrastructure Investment and Jobs Act, commonly referred to as the Bipartisan Infrastructure Law (BIL). The BIL provides $108.2 billion for public transit over five years (FY 2022 through FY 2026).
Transit agencies across the country are working toward a state of good repair, providing economic opportunities to their communities, and driving innovation and clean technology. For example:
- The Northern Indiana Commuter Transportation District added 26 miles to double track its South Shore Line. It eliminates 13 grade crossings, adds 14 new weekday trains, and cuts the travel to Chicago by 30 minutes. The project, awarded a construction grant agreement in 2021, was completed on time and under budget and opened last month.
- Valley Metro also completed its 2021 Northwest Extension Phase II light rail project ahead of schedule and under budget. The project connects the West Valley to downtown Phoenix and neighboring communities and is already averaging 50,000 riders per month since opening in January 2024. Phoenix is now working on redeveloping its new terminus—a former mall—into multi-family housing, hotels, restaurants, and new retail space.
- Skagit Transit, in a small Washington State community, is moving its operations facility, currently located in a 100-year floodplain, to a new facility with clean energy infrastructure that will enable a transition to a zero-emission fleet. In addition, the facility will help Skagit Transit, as a partner in county emergency preparedness operations, support community resiliency during emergency events.
APTA urges Congress to honor the promise of the Bipartisan Infrastructure Law and build upon this success. Specifically, we urge Congress to fully fund public transportation as authorized by the BIL:
- provide at least $21.9 billion for public transit and $20.6 billion for passenger rail in the FY 2025 Transportation, Housing and Urban Development, and Related Agencies Appropriations Act; and
- accelerate project delivery by enacting commonsense regulatory reform, such as streamlining real property acquisition for public transit projects.
This BIL funding is an investment in our nation’s economic recovery and future.
Creating Jobs, Growing the Economy, and Providing Opportunities
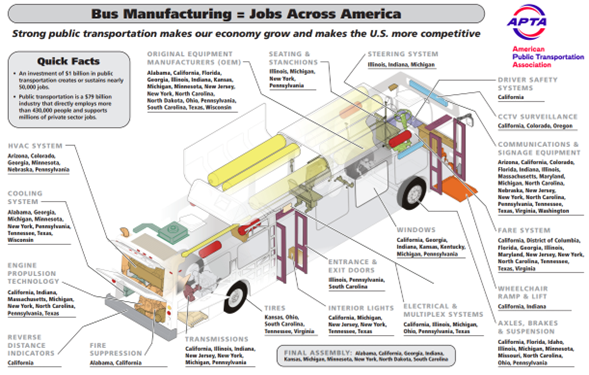
Each $1 invested in public transportation generates $5 in long-term economic returns.8 Every $1 billion invested in public transportation creates or sustains nearly 50,000 jobs across the entire economy, including in non-transit industries.9 Investment in public transportation creates jobs in communities of all sizes throughout the country, including in smaller urban and rural areas where buses, railcars, and their parts are often manufactured.
Moreover, more than $42 billion, or almost 60 percent, of public transit investment flows directly to the private sector—a 65 percent increase since 2000.
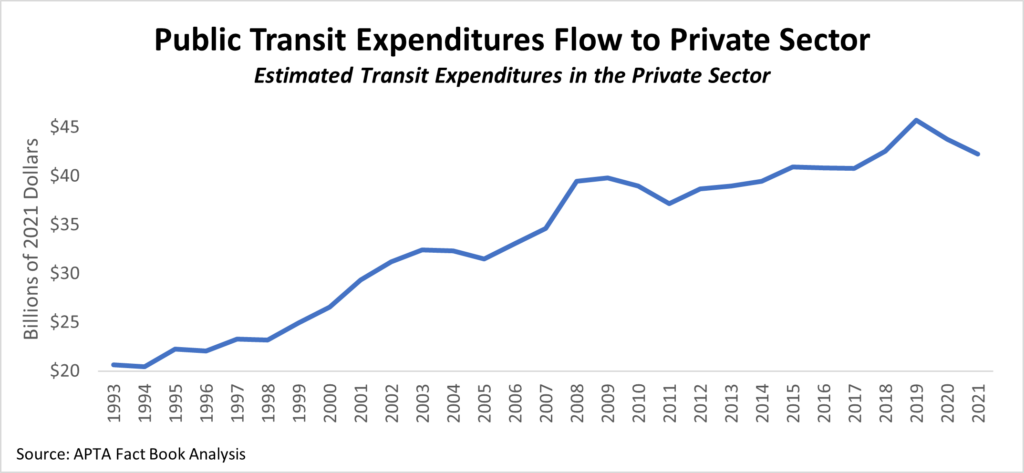
In addition, the public transportation industry provides investment opportunities across the country, ranging from manufacturing to design and construction, to operations and maintenance, to data management and technological innovation. Public transportation manufacturing relies on more than 2,000 suppliers in 48 States and Washington, DC. And public transportation agencies rely on their private-sector partners to help deliver innovative transit projects efficiently.
For instance, a Capital Investment Grants (CIG) project in California may include thousands of construction jobs onsite, but its rolling stock, parts, or materials may come from manufacturers and suppliers in Alabama, Georgia, Kansas, or Pennsylvania.
Bus Manufacturing and Rail Manufacturing Schematics:
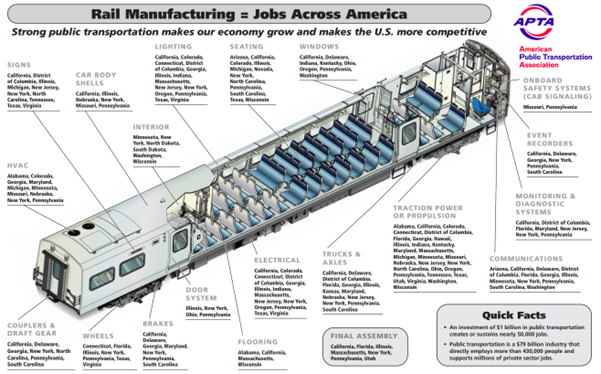
Moreover, after a new transit line is constructed and operational, there are ongoing, permanent economic growth and development impacts enabled by the transportation improvements and associated economic productivity gains.
Traveling Safely to Your Destination
For the public transportation industry, safety is a core value—a non-negotiable operating principle and promise to our riders and workers. The men and women responsible for managing and operating public transportation systems are fully committed to the safety of their passengers, employees, systems, and the public. As a result, traveling by public transportation is 10 times safer for passengers than traveling by car, and modest increases in transit ridership can cut traffic fatalities by one-half.10
Rider-focused investments to improve service, safety, and accessibility are why ridership is increasing across the country. To address transit safety concerns, many agencies are adopting a layered approach, using “transit ambassadors”, mental health professionals, public awareness campaigns, and more law enforcement personnel.
At RTC, safety and security are of paramount importance. Over the past three years, RTC has invested more than $33 million in additional safety and security measures to continue keeping its customers and operators safe. RTC is the first transit agency in the nation to install GPS-based security devices on its 450 fixed-route buses that operators can activate if they need to notify a security contractor and the bus operations center of a safety or security incident, even if the operator has departed from the bus.
In July, RTC will increase the number of armed security officers by nearly 12 percent (from 271 to 304 officers) and more than double the number of roving security vehicles (from six to 14 vehicles). Security officers will focus on enforcing RTC’s fare policy to reduce the number of chronic violators and friction between them and operators.
Providing Rural Access
Today, approximately 6,800 organizations provide public transportation, and the majority of agencies serve rural areas. According to Federal Transit Administration (FTA) data, 1,281 transit agencies operate in rural areas and 929 transit agencies operate in urbanized areas (i.e., areas with a population of 50,000 or more). In addition, there are approximately 4,580 nonprofit public transportation providers operating across the nation.
In rural areas, especially for seniors and people with disabilities, public transportation is a lifeline. Rural residents with disabilities rely heavily on public transit, taking approximately 50 percent more public transit trips than those without disabilities.11
Ridership in rural areas is estimated to be 107 million annual trips. Public transit is critical for connecting users to needed services, including access to medical care for the almost five million U.S. veterans living in rural areas and for providing Medicaid recipients with non-emergency medical transportation (NEMT) services to mental health, substance abuse, chemotherapy, dialysis, and other critical chronic and preventive care appointments.
Addressing State-of-Good-Repair Needs
With a state-of-good-repair backlog of more than $101 billion and growing, support from all levels of government is sorely needed. Today, most agencies are operating buses and railcars beyond their useful lives. Of the 119,000 transit buses and vans, almost one in six are not in a state of good repair.12 For rail transit vehicles, the average fleet age is 24 years. Agencies are using the historic investments of the BIL to begin to bring their rolling stock, guideway elements, systems, stations, and facilities to a state of good repair.13
To help address rail rolling stock state-of-good-repair needs, the BIL specifically created the Rail Vehicle Replacement program to provide grants to public transit agencies to replace their aging fleets with new, American-made railcars. For instance, Chicago’s Metra commuter railroad received a grant to procure 50 modern, multi-level railcars to replace 50-year-old railcars built in the mid-1970s that include asbestos materials and do not meet current crashworthiness standards or comply with the Americans with Disabilities Act. The new cars will be more efficient, improve reliability, and provide a better experience for the traveling public.
Providing More Mobility Choices
Public transit investment also helps communities begin to address the demand for more mobility choices. CIG funding provides critical investments for new and expanded subways, light rail, commuter rail, streetcars, and bus rapid transit (BRT), among others. Over the past 15 years, 28 States have received CIG construction grant agreements or are in the current pipeline. From BRT projects in Minnesota, Nevada, and Pennsylvania; to commuter rail projects in Texas and Indiana; and heavy and light rail projects in Arizona, California, New York, and Utah. Public transportation projects that are funded through the CIG program are an essential component of addressing the mobility demands of growing communities. Today, 65 projects across the nation are seeking almost $45 billion of CIG funding in FY 2025 and subsequent years.14
CIG Projects from 2010-Present
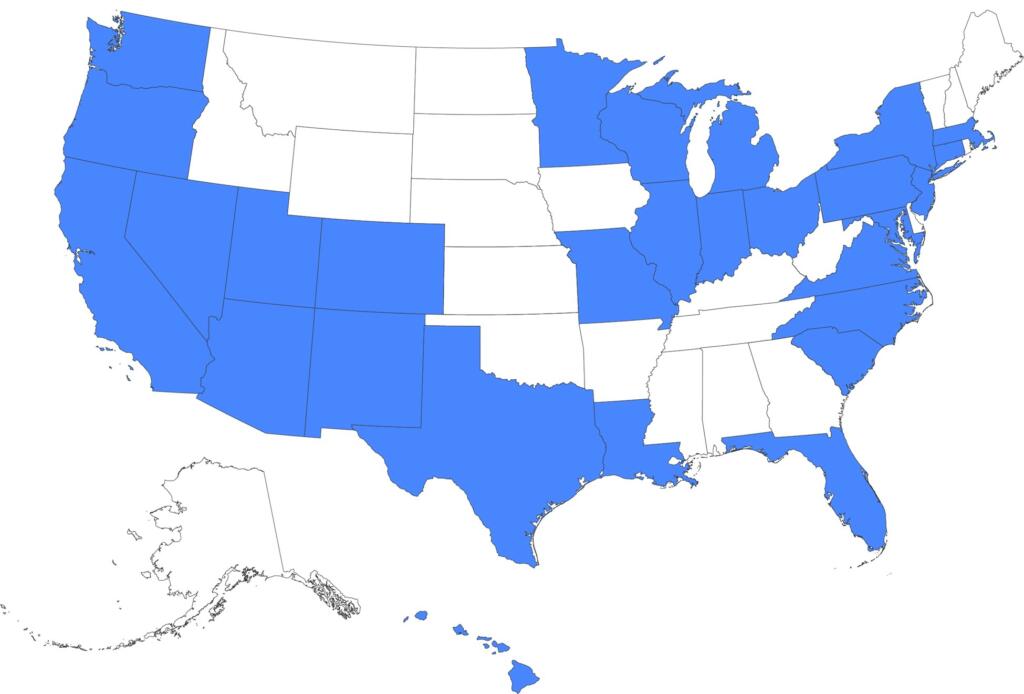
For example, RTC’s Maryland Parkway BRT will transform the 13-mile corridor for the benefit of everyone in the region. Home to 90,000 residents, 85,000 jobs, and 9,000 daily transit riders, the Maryland Parkway BRT will connect residents to jobs, education, medical services, shopping, and neighborhood services. FTA’s $150 million investment will ensure Southern Nevada residents and visitors have better options while traveling to Harry Reid International Airport, the University of Nevada, Las Vegas (UNLV), Sunrise Hospital, and other important areas of the city. In addition, buses, bikes, cars, and pedestrians will all experience safer conditions thanks to wider sidewalks, enhanced transit shelters, improved lighting, and better roadways.
Driving Innovation in Clean Technologies
Finally, public transit is at the forefront of innovation, particularly in clean technologies. From hybrid buses to light rail systems, public transportation agencies are leveraging new technologies to promote clean energy, electric vehicle deployment, and fuel efficiency. Currently, 49 percent of transit buses use alternative fuels, with nearly 18 percent of all buses utilizing hybrid-electric technology, compared to only 2.2 percent of U.S. cars and Sport Utility Vehicles. Today, there are more than 1,500 zero-emission buses in service with hundreds more battery electric and hydrogen buses on order.15
Communities that invest in public transit reduce the nation’s carbon emissions by 63 million metric tons annually. Overall, public transportation saves the U.S. six billion gallons of gasoline each year. The public transit industry will continue to lead the way in adopting new technologies.
Conclusion
On behalf of APTA, thank you for including us in this important hearing. In each of your Congressional Districts, public transportation provides very real benefits to your constituents, their communities, and the national transportation network. To maintain our position as a global leader, our country needs more job creation, a stronger economy, a cleaner environment, and more opportunity—and sustained investments in public transportation will lead the way.
Appendix A
Compared to pre-pandemic ridership, bus ridership has consistently recovered faster than rail services because rail ridership has seen greater impacts from work-from-home and downtown occupancy trends. In addition, bus systems tend to serve more transit-dependent riders and non-commute trips, which have more closely returned to pre-pandemic levels.
1 APTA represents all modes of public transportation and all elements of the industry from public agencies to manufacturers. APTA members include public transportation systems; planning, design, construction, and finance firms; product and service providers; academic institutions; state transit associations; and state departments of transportation.
2 RTC’s general ridership (83 percent) has recovered at a much faster pace than its Las Vegas Strip/tourist ridership (56 percent).
3 See Appendix A for APTA data comparing bus and rail transit ridership.
4 See generally, APTA, Mobility Innovation: The Case for Federal Investment and Support (July 2021).
5 For example, the Washington Metropolitan Area Transit Authority (WMATA) is retrofitting faregates with new barriers to prevent fare evasion, resulting in a 79 percent decrease in fare evasion at those stations. Metro Transit Police have also stepped-up fare enforcement efforts. Systemwide, fare evasion is down 69 percent compared to last year. WMATA, With Ridership Up and Crime, Fare Evasion Down, Metro Continues to Thrive (April 4, 2024).
6 The Federal Government provides one-third of capital funding but less than 10 percent of operations funding. Under current law, public transit agencies in large, urbanized areas (i.e., areas with a population of 200,000 or more) may not use Federal transit formula funds for operating assistance. These funds are only available for capital projects. Conversely, transit agencies in smaller communities may use Federal transit formula funds for operating or capital expenses, although the Federal share is lower for operating assistance grants.
7 APTA, Public Transit Agencies Face Severe Fiscal Cliff (June 2023). Seven of 10 large agencies (71 percent) stated that they are likely to experience a fiscal cliff in the next five years. The operating budget shortfalls that the largest agencies expect to encounter range from 10 to 30 percent of their operating budgets. Id.
8 APTA, Economic Impact of Public Transportation Investment—2020 Update (February 2020).
9 Id. Public transportation can also enhance the productivity of industries not directly associated with transit, such as the technology industry.
10 See APTA, Public Transit Is Key Strategy in Advancing Vision Zero, Eliminating Traffic Fatalities (August 2018).
11 APTA, Public Transportation’s Impact on Rural and Small Towns (2017).
12 See, U.S. Department of Transportation, Federal Highway Administration and Federal Transit Administration, Status of the Nation’s Highways, Bridges, and Transit: Conditions & Performance Report to Congress, 25th Edition (2024), at page ES-13.
13 Id.
14 APTA’s Capital Investment Grant Project Pipeline Dashboard (June 4, 2024).
15 APTA, 2023 Vehicle Database (September 2023).
